The cost-per-token graph is not the cost-per-task graph. The capex numbers prove it.
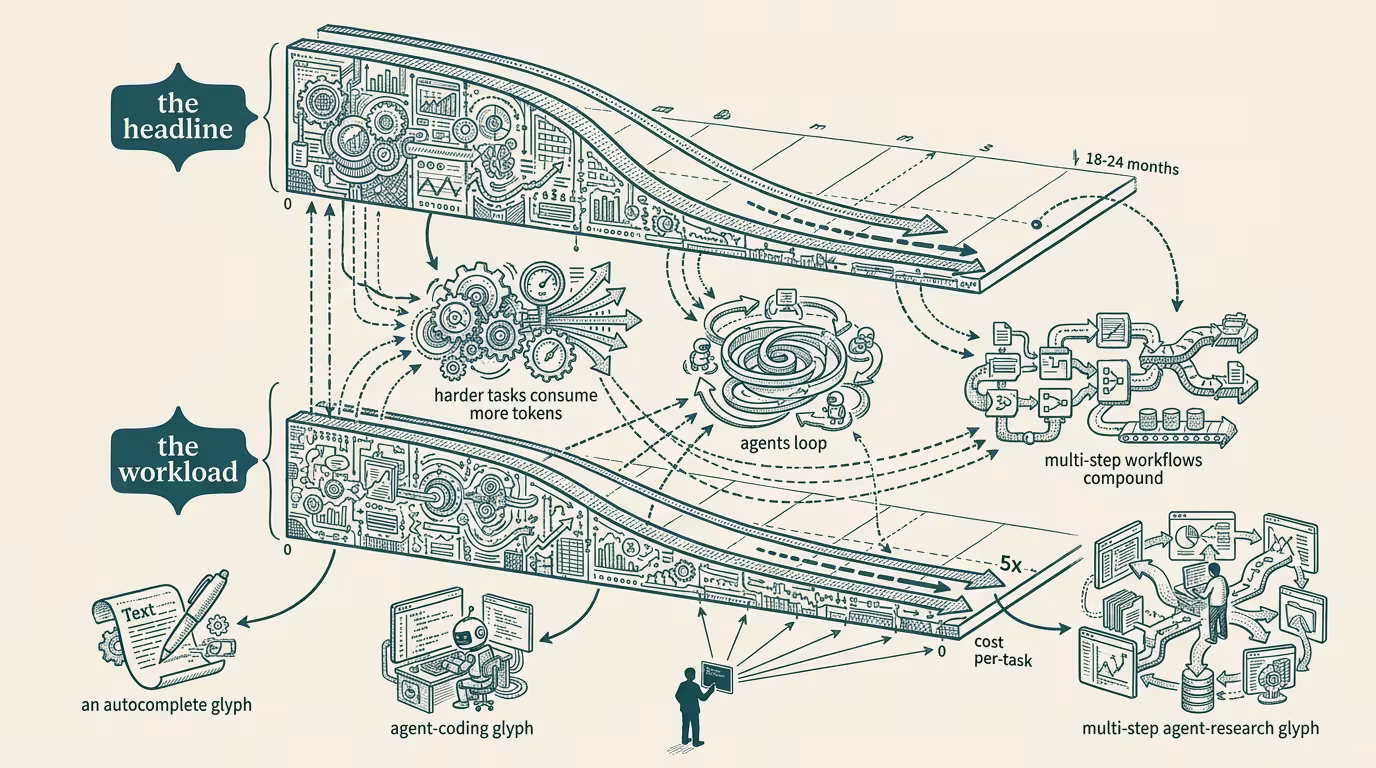
Every AI cost-decline graph the trade press has run in 2024 shows the same shape. Cost per token down 100x in 18 months. Cost per token down 1000x in 24 months. The chart's slope is steeper than Moore's Law. The headline writes itself: _AI is getting cheap, fast._
The headline is true and useless. The actual operator question is cost per task, not cost per token. Those are different graphs. They are different graphs because tasks consume more tokens as they get harder, agents loop on themselves to verify their own work, and the workflow that used to take a 4K-token prompt and a 500-token response in 2023 now takes a 60K-token agentic loop with five tool calls and a 12K-token verification step in 2024. The cost-per-token line dropped 100x. The cost-per-task line dropped 5x. Those are not the same line.
I have been running production agent workloads long enough to have the actual numbers, and the actual numbers are worth holding next to the trade-press graph.
Workload one: a customer-service triage agent. In 2023 the workload was a single LLM call: customer message in, structured-output triage classification out. Token cost: $0.002 per message. By 2024 the same triage workflow was an agent with three sub-calls (classification, sentiment, prior-history-lookup) plus a confidence-threshold loop that triggers a second pass for low-confidence cases. Token cost per _task_, including the loops: $0.011. The per-token cost dropped roughly 100x in the same window. The per-task cost rose 5x.
The customer-service triage workload got more expensive _while the per-token cost was visibly collapsing_. Both numbers were true. The trade-press graph showed the collapse. The operator's quarterly budget showed the rise.
Workload two: a code-review agent. In 2023 the workload was a one-shot review: pull request in, comments out. Token cost: $0.05 per PR. By 2024 the review agent runs three iterations with cross-file context, calls the test runner as a tool, calls the static analyzer as a tool, and re-reviews after the agent's own suggested changes. Token cost per _task_: $0.30 per PR. Per-token down ~100x. Per-task up 6x.
Workload three: a documentation pipeline. The 2023 version was prompt → structured doc out. The 2024 version is an agent loop that reads the codebase, drafts the doc, calls a verifier sub-agent that checks the doc against the code, iterates on the verifier's feedback, then writes a final version with cross-references. Token cost per task in 2023: $0.40. Token cost per task in 2024: $1.10. Per-token down. Per-task up.
Three workloads. Three workloads where the per-token cost-decline graph promised one thing and the per-task cost-up graph delivered the opposite. The trade-press graph is, of course, the per-token graph.
What the per-token graph misses is structural. Cheaper tokens enable more aggressive workflows. More aggressive workflows consume more tokens. The token-saturation rate of any given workflow rises to fill the capacity the cost-decline opens up. The phenomenon is the AI-stack equivalent of induced demand on a highway: build more lanes, more cars show up, the commute time does not actually drop.
The capex numbers prove it.
The hyperscalers' AI capex curves through 2024 have been climbing on a steeper-than-token-cost trajectory. Amazon, Microsoft, Google, Meta combined are spending more on inference infrastructure in 2024 than the same companies spent on all data-center capex five years prior. If per-token cost were genuinely collapsing in the way the trade-press graph implies, total inference spend should be flat-or-declining, because the per-task workload should cost less. Total inference spend is not flat. It is up. The capex numbers prove that the per-task workload is going up, not down, even with the per-token cost compressing.
That is the structural truth the per-token graph hides.
Three operator-class implications follow.
First, the operator's AI budget cannot be planned against the per-token cost-decline curve. _It has to be planned against the per-task curve._ The per-task curve is workload-specific, it depends on what kind of agentic loops the operator is running, and it can be flat or rising even as the model-API price quote drops 90%. The operator who plans the 2025 budget against the trade-press cost-decline graph is the operator whose CFO surfaces a budget overrun in Q3 2025 and asks why nobody saw it coming. The answer is that the operator was looking at the wrong graph.
Second, the workflow architecture is the load-bearing cost variable. Two operators running the same notional workload (say, "customer-service triage") on the same model can have a 5-10x cost difference per task depending on how aggressive the agentic loop is, how many sub-calls each task triggers, how many verification passes the operator runs. The operator who tunes the agentic loop for cost is, by 2025, paying half what the operator who turned every workflow into a 5-iteration agentic loop is paying. That gap is, in operator-grade terms, the difference between a profitable AI deployment and a loss-leader AI deployment.
Third, the per-token cost decline does _not_ land as customer-pricing decline at the same rate. The AI vendor whose cost decline is showing up in the model-API price is not the same AI vendor whose per-task cost decline is showing up at the operator's procurement line. Klarna, Notion, Shopify, every operator running production AI knows this and the trade press does not. The vendor pricing absorbs some of the per-token cost decline as margin recovery from the bear-case period of 2023; the rest gets passed through. The per-task cost decline is, on the operator's actual spend line, materially smaller than what the trade-press graph implied.
What does the right graph look like?
The right graph plots per-task cost over time for a held-constant workload definition. Three datapoints needed: the operator's task cost in 2022, in 2023, and in 2024. Most operators have not been keeping that data. The operators who have are the operators making the smartest 2025 capex decisions. The trade press is not running this graph because the trade press does not have the per-operator workload data. The vendor running the cost-decline narrative has access to enough data to know the per-task picture is not what the per-token graph shows, and the vendor is not running the corrected graph because the corrected graph would not produce the headline the vendor wants.
The operator who builds an internal per-task cost dashboard in late 2024 is the operator who wins 2025 budget conversations. The dashboard is six numbers. Per-workload, last 12 months: total tokens consumed, total tasks executed, ratio. Per-vendor: average per-token cost paid. Per-quarter: per-task cost trend. Six numbers. Most operators don't have them. The operators who do are running circles around the rest in the procurement room.
The honest summary: the trade press is plotting the wrong graph. The per-token cost decline is real and is hiding the per-task cost rise that has been operationally true since the agentic-loop architecture became the default in 2024. The capex numbers from the hyperscalers prove the structural picture. The operator implication is to plan against per-task cost, not per-token cost, and to build the dashboard that surfaces the truth before the CFO finds it accidentally.
The cost-per-token graph is not the cost-per-task graph. The capex numbers prove it. The operators who internalize the difference run profitable AI deployments. The operators who treat the trade-press graph as actionable run loss-leader deployments and discover the gap when the quarterly bill lands.
—TJ